Examining the Correlation between Insider Buying and Subsequent Stock Performance

Peter Lynch, the legendary former manager of Fidelity’s Magellan fund once said “Insiders might sell their shares for any number of reasons, but they buy them for only one: they think the price will rise”. In the years since Lynch made this statement, it has become a common maxim that insider buying (the purchase of shares in a corporation by an officer, director, or major shareholder within the company) is an indication that there is something brewing at the company that will soon be followed with an abnormal positive performance of the stock price.
But is this always the case? Is every insider purchase followed by a gain? By how much do these gains eclipse that of the stock’s usual performance? Is it possible that in some cases this is nothing more than a C-level officer trying to instill the public’s confidence in the stock by putting his own money on the line? In this article I will attempt to answer these questions with candid research.
The Analysis
To answer these questions, we will assess the performance of S&P 500 components following insider purchases made between 2010 through 2019. For each insider purchase, we will measure the performance of the stock at the following intervals after the purchase date:
- 14 Days
- 30 Days
- 90 Days
- 180 Days
- 360 Days
All of these post-purchase performances will then be averaged together to establish the average performance of this stock following an insider purchase. So, for example, if Boeing (BA) had three insider purchases, the 14-day performance for all three will be averaged to get the “average 14-day performance following an insider purchase”; the same will be done for the 30-day, the 90-day, and so on. This performance set will then be compared to the stock’s average performance (for these same intervals) over the course of 2010 through 2019. By comparing the stock’s average performance in ten years to the stock’s immediate performance following an insider purchase, we can gain insight into the correlation between insider buying and stock performance.
Filtering to 2010–2019 Transactions
We will be using Aletheia’s (https://aletheiaapi.com/) API service for accessing insider trading data for the S&P 500. Aletheia has a terrific endpoint that provides insider trading history for any publicly traded company: https://aletheiaapi.com/docs/#latest-transactions. Aletheia’s service provides the ability to query insider transactions for a particular company and filter the results to only equity-based security purchases that occurred between 2010–2019.
The below metrics pertain to the full S&P 500 from 2010 through 2019.
- Insider Transactions: 584,246
- Average per company: 1,162
- Most insider-trading active company: Facebook (FB) with 7,375 insider trades during this time
- The following companies were tied for the fewest number of insider trades with 0 equity transactions each:
- APA Corporation (APA)
- Carrier Global Corporation (CARR)
- Organon & Co (OGN)
- Otis Worldwide Corporation (OTIS)
- Viatris (VTRS)
You can find the full data set used to compile the above results in JSON format here.
Filtering to Purchase Acquisitions
Building from the time-filtered transactions set from above, we now will further filter our data set to only include Open market or private purchases of securities. This means the insiders themselves voluntarily purchased shares of their associated company with their own funding — putting their own money on the line! This is (supposedly) the most indicative of bullish insider sentiment. The below metrics describe the number of insider purchase acquisitions during 2010–2019 for the S&P 500:
- Transactions: 13,639
- Average per company: 27
- Median per company: 10 — As seen here, there were several outliers that had a disproportionately large number of insider buys between 2010–2019. The gap between the average (mean) and median is indicative of this.
- Most transactions: Bank of America (BAC) with 1,769 insider buys
- 32 companies were tied for fewest insider purchases during this time period with 0 trades.
Removing Companies with Insufficient Historical Data
Not every component of the S&P 500 has been publicly traded from 2010 through 2019. Our research is exclusively focusing on this ten-year span. Our data could easily become skewed if we forecasted a ten-year average return for a company that has only been traded recently. For this reason, we will only focus on companies that have been trading during the full 2010–2019 timespan.
Including this filter noted above, we arrive at 9,611 insider purchase transactions across 401 companies with well-formed data that can be used in this analysis.
A spreadsheet with the count of transactions per S&P 500 component is available at the end of this writing.
Analysis Results
As planned, we compare the average performance of each stock following an insider purchase to the average returns over the ten year period from 2010 through 2019. It would take a while to do the described data collection and analysis by hand! I wrote a .NET-based (C#) program to expedite this process across each component of the S&P 500. After the program collected and analyzed the necessary data for almost seventy uninterrupted hours, we have our results!
You can find the full analysis sets that were used to compile the below statistics in JSON format here. Each object (file) contains the subject stock, average performance over the ten-year timeframe, and performances following each qualifying insider purchase.
It is clear that stock performance following an insider purchase typically outperforms in both the short and long term as compared to the stock’s typical historical returns.
The table below shows the number of companies that have insiders that usually overperform following a buy versus those that underperform. As you can see, about 62% of the S&P 500 have insiders that have historically outperformed typical capital returns in the short and long term after executing their buy orders.
(The “Outperformed” and “Underperformed” columns refer to the number of S&P 500 components)
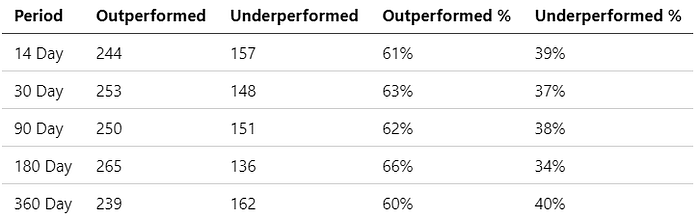
Note that there were also several companies that do not fall in either bucket — stock performance drew level with typical returns following insider buys.
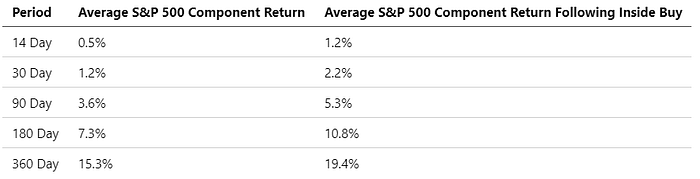
We can also average each period performance of each component to get the average performance for each period in each scenario — typical returns versus returns following an insider buy.
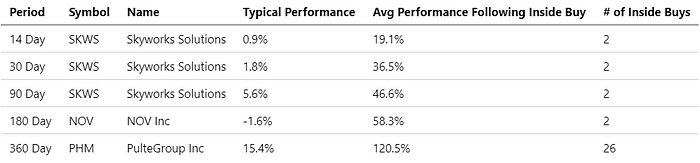
Furthermore, we can dig deeper and discover which company insiders achieve the highest level of outperformance following a purchase.
Greatest Outperformance Following Inside Buys
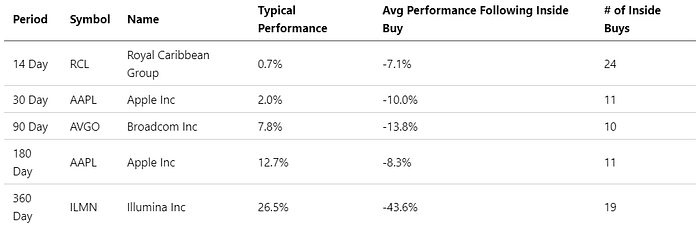
We can also take a closer look at the opposite — which stocks are likely to lag behind their average returns following an insider purchase?
Laggards Following Inside Buys
Results Interpretation
The evidence clearly shows that, on average, stocks will outperform following an insider purchase in both the short and long term. In the short term, this outperformance is sometimes as much as double the typical capital return. In the long term, this edge hovers around 415 basis points above the typical capital returns you would see in a non-insider purchase period.
So how do we interpret this? Unsurprisingly, this likely confirms that insiders are trading with “insider information”, information that they uniquely benefit from due to their close relationship with the subject company. This information allows them to better predict future prospects of the company and to coordinate their purchasing with company press releases, product development breakthroughs, or industry-related news. This is strongly evident in the table shown above that highlights the highest outperforming stocks following insider purchases; these insiders may have made trades selectively ahead of important achievements in the company’s results or R&D. The insider information allowed them the foresight to get into the stock at desirable levels.
On the flip side, this could mean something very different for the insider buys that went wrong. Of the 401 companies that we examined, 162 of them (40%) underperformed following an insider purchase in the long run. This may be the result of several C-Suite executives purchasing stock in their own company in an attempt to instill the public’s confidence in their company’s publicly traded common stock. If this is the case, we could further suppose that these insiders are buying stock ahead of particularly trying times (their buying could be interpreted as an attempt to “counteract” this) and in the long run these trying times got the better of the company in the markets.
Close
Broadly speaking, you can expect stocks to outperform in both the short and long term following an insider purchase. This is a rule of thumb, not a law, and has been proven otherwise in many cases. However, the fact that the majority of insider purchases are followed by outperformance in the stock price underscores the importance of staying up to date on insider trading, and in particular insider buying, if you are an active investor.
For the developers out there, Aletheia provides a free Insider Trading Webhook. You can specify a company, insider, security type, or transaction type and have Aletheia’s webhook service call your endpoint within seconds of the transactions being reported to the Securities Exchange Commission (SEC).
If you would like to sharpen your investor savvy, review the results of this analysis for each company to see for yourself which S&P 500 components outperform following an insider buy and which underperform. This will likely help when deciding to invest in the next company who’s CEO just spent their salary buying their own stock!